

Toutes les compétences
Données et recherche
CSV vers constats et graphiques
Un CSV devient des constats, des graphiques suggérés et des réserves.
La démo utilise des données fictives. La sortie affichée est ce que la compétence a produit avec cet exemple d'entrée.
Essaie en 3 étapes
- 01
Copie le dossier, ou seulement SKILL.md, dans .claude/skills/ de ton projet (ou dans ~/.claude/skills/ pour l'utiliser partout).
- 02
Ouvre Claude Code et demande-la par son nom, par exemple : Utilise la compétence csv-insights sur mes fichiers.
- 03
Vérifie le résultat. Les compétences créent un nouveau fichier et n'écrasent jamais les tiens.
Voir un exemple d'exécution
Exemple d'entrée · input.csv
month,channel,orders,revenue_eur,ad_spend_eur,refunds
2025-01,Web,120,4980.00,900,
2025-02,Web,126,5292.00,950,
2025-03,Web,131,5344.80,980,
2025-04,Web,140,6034.00,1100,
2025-05,Web,152,6490.40,1250,4
2025-06,Web,158,6952.00,1300,5
2025-07,Web,171,7438.50,1400,5
2025-08,Web,180,8064.00,1500,6
2025-09,Web,188,8497.60,1550,6
2025-10,Web,201,9246.00,1700,7
2025-01,Email,64,2432.00,150,1
2025-02,Email,61,2287.50,150,2
2025-03,Email,70,2744.00,160,1
2025-04,Email,66,2560.80,160,2
2025-05,Email,73,2927.30,170,2
2025-06,Email,69,2732.40,170,1
2025-07,Email,75,3075.00,180,3
2025-08,Email,72,2908.80,180,2
2025-09,Email,78,3260.40,190,2
2025-10,Email,80,3376.00,190,3
2025-01,Market,90,2691.00,0,3
2025-02,Market,85,2592.50,0,2
2025-03,Market,97,2832.40,0,4
2025-04,Market,110,3410.00,0,5
2025-05,Market,104,3130.40,0,3
2025-06,Market,121,3799.40,0,6
2025-07,Market,118,3634.40,0,4
2025-08,Market,133,4256.00,0,7
2025-09,Market,129,4063.50,0,5
2025-10,Market,142,4629.20,0,8
Exemple de sortie · output.md
# CSV insights: input.csv

## Data profile
- 30 rows, 6 columns: month, channel, orders, revenue_eur, ad_spend_eur, refunds
- Period: 2025-01 to 2025-10 (10 months), 3 channels (Web, Email, Market), 10 rows each
- Missing values: refunds is empty in 4 of 30 rows (13.3%), all Web, 2025-01 to 2025-04; no other column has gaps
- Total revenue: 131,682.30 EUR

## Findings
1. Web is the largest channel with 68,339.30 EUR (51.9% of revenue), then Market 35,038.80 EUR (26.6%) and Email 28,304.20 EUR (21.5%).
2. Monthly revenue grew from 2025-01 to 2025-10 in every channel: Web +85.7%, Market +72.0%, Email +38.8%.
3. Web ad spend and Web revenue move together (Pearson r = 0.996, n = 10).
4. Web returned 5.53 EUR of revenue per euro of ad spend in 2025-01 and 5.44 in 2025-10 (5.41 over the whole period), a small drop, so the return per euro is roughly flat.
5. Refund rate (refunds per order, rows with data only): Market 4.2%, Email 2.7%, Web 3.1%.
6. Best single row: Web in 2025-10 with 9,246.00 EUR; the median Market month is 3,522.20 EUR.

## Suggested charts
- Line chart: revenue_eur by month, one line per channel (shows finding 2)
- Stacked bar: revenue share by channel per month (shows finding 1)
- Scatter: Web ad_spend_eur vs revenue_eur, one point per month (shows finding 3)
- Bar: refund rate by channel (shows finding 5; label the Web bar "6 months of data")

## Caveats
- Small sample: 30 rows, only 10 months per channel. Treat percentages as descriptive, not as a forecast.
- Missing values: 4 Web refund cells are empty. They were left out of the refund rate, not filled with 0. The Web rate covers 2025-05 to 2025-10 only.
- Correlation is not causation: r = 0.996 for Web spend and revenue does not show that spend caused the growth. Spend and revenue may both rise with season or demand.
- Only totals are available, so nothing here says which products or customers drive the change.
- No test of statistical significance was run.

## Questions to ask the data owner
- Were the empty Web refund cells 0 or not tracked?
- Is Market ad spend really 0, or is it recorded elsewhere?
La compétence · SKILL.md
---
name: csv-insights
description: Turns a CSV file into plain-English findings, suggested charts and honest caveats about sample size, missing values and correlation. Use when someone hands over a spreadsheet export and asks what is in it, what stands out, or what to chart.
---
# CSV insights

Turn a CSV into numbered findings, chart ideas and caveats, with every number computed, not estimated.

## When to use
- The user shares a .csv and asks "what does this say?", "what stands out?" or "what should I chart?"
- You need a quick read of an export before a meeting or a deeper analysis.

## Inputs
- Path to one CSV file. If missing, ask for it.
- Optional: the question they care about (for example "which channel is growing?"). If none, ask once; if still none, profile broadly.
- Ask what the units are when a column name is unclear (currency, thousands, percent).

## Steps
1. Read the file with a short Python script (csv and statistics from the standard library). Print row count, column names, and the type of each column.
2. Count missing or empty cells per column and note which rows they sit in.
3. For each numeric column compute total, mean, median, min and max. For each category column compute row counts and shares.
4. Compare the first and last period per group (percent change) and note the best and worst rows.
5. For pairs of numeric columns that may be related, compute the Pearson correlation and the number of pairs used.
6. Write 4 to 7 findings. Each one states one number taken from step 3 to 5 and what it means in one sentence.
7. Suggest 3 to 5 charts. Name the chart type, the x and y columns, and which finding it shows.
8. Write caveats: sample size, missing values and how you treated them, correlation is not causation, anything the columns cannot tell.
9. List questions for the data owner about gaps and unclear columns.

## Output
Write `<csv name>-insights.md` next to the input, as a new file, with these sections in order:
- `## Data profile` (rows, columns, period, missing values, key total)
- `## Findings` (numbered, each with its number)
- `## Suggested charts` (type, columns, which finding)
- `## Caveats`
- `## Questions to ask the data owner`

## Rules
- Never invent numbers, columns or causes. Every figure comes from code you ran on the file.
- Write results to a new file, never overwrite the CSV or an earlier report.
- Do not fill missing values with 0 or averages. Exclude them and say so.
- Say "moves together", never "causes", for correlations; always show n.
- Flag samples under 30 rows or 12 periods as small.
- Keep the data local; do not upload it anywhere.
- Out of scope: financial, legal, medical or tax advice. Flag items for a professional.
Les compétences t'aident à lire et à organiser. Ce ne sont pas des conseils juridiques, médicaux, fiscaux ou financiers.
Plus de compétences
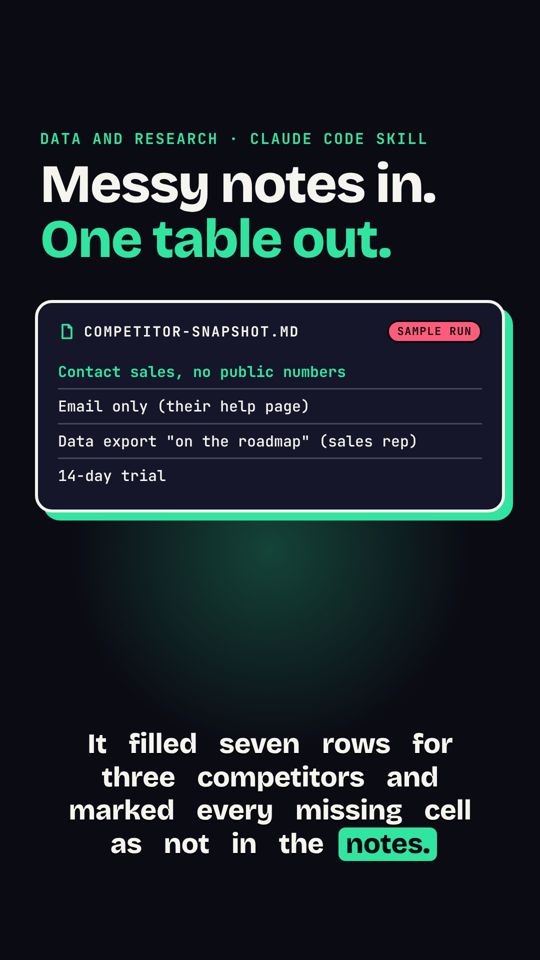 Notes concurrents vers tableauDes notes collées sur des concurrents deviennent un tableau comparatif.
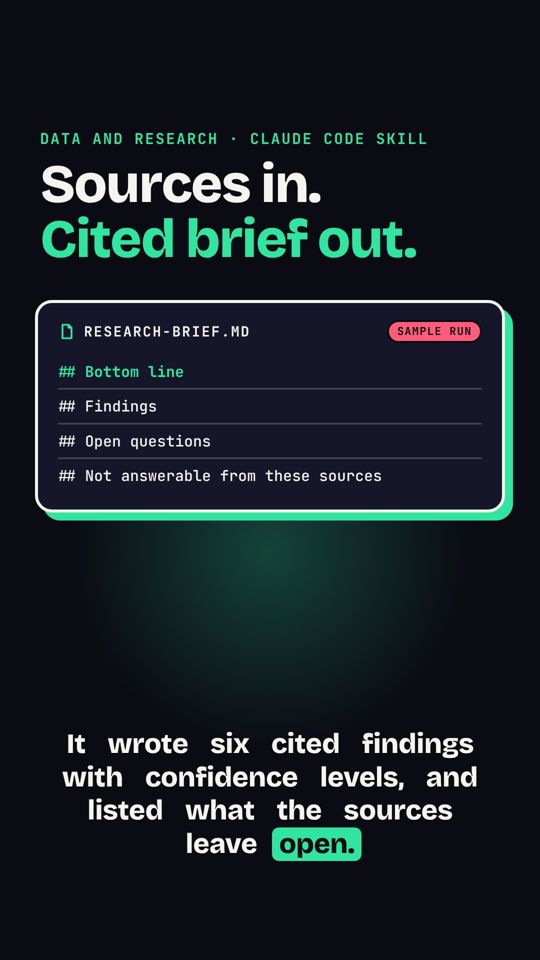 Sources vers brief sourcéDes sources collées deviennent un brief avec citations et niveaux de confiance.
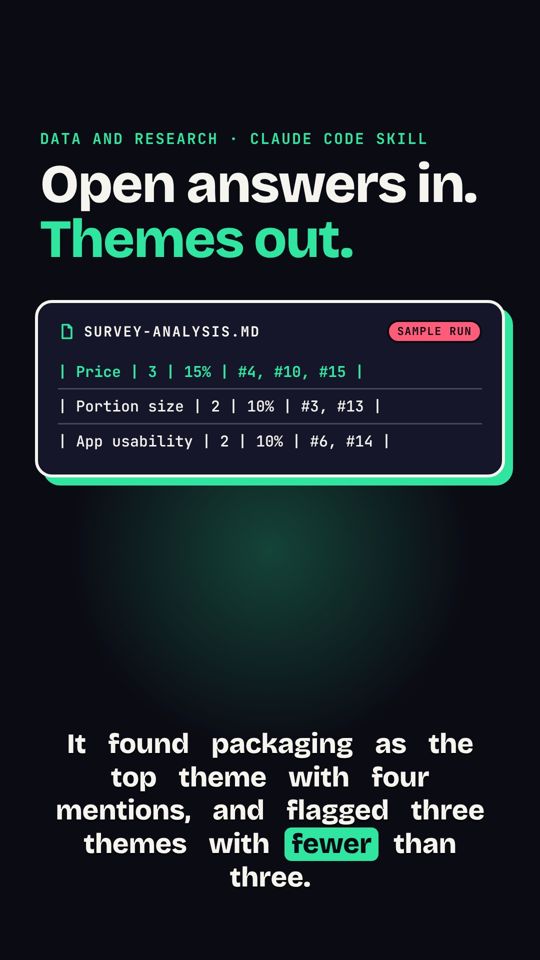 Réponses de sondage en thèmesDes réponses libres deviennent des thèmes, avec effectifs et citations.